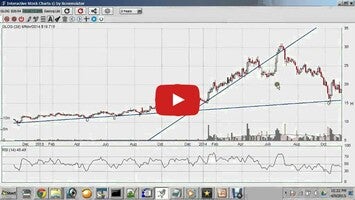
Interactive Stock Charts is an innovative and sophisticated stock analysis tool designed to enhance your trading strategy. As you navigate through financial markets, it provides an array of features to assist in analyzing stock data with unparalleled precision.
The main purpose of Interactive Stock Charts is to deliver live, touch-responsive stock charts to your fingertips, boasting a seamless user interface. Users have the flexibility to adjust time frames, smoothly scroll through historical prices, pan across various data points, and zoom in for in-depth analysis. Detailed quotes and values for technical indicators are accessible with a simple touch on the corresponding price points.
For those who engage in active trading, the platform directly interfaces with Tradier Brokerage, enabling the execution of equity and options trades right from the charts. It stands out with its automated recognition engine, identifying chart patterns and trendline formations based on Screenulator's patented technology.
Additionally, its built-in Candlestick Pattern Scanner and Indicator Reliability Lab equip traders with instant backtesting capabilities to project the effectiveness of various trading patterns and indicators.
Driven by AI and Deep Learning Neural Networks, Interactive Stock Charts has a strong foundation, with backtesting performed on over half a century of market data. The aim is to supply insights that contend with the unpredictability of markets, boosting trading decisions.
Apart from the advanced trendline analysis and Trend Reversal indicators, classic technical analysis resources such as RSI, MACD, Bollinger Bands, and Fibonacci Retracement are included. These are complemented by a real-time RSS news feed, providing topical market news that could impact trading strategies.
The platform offers a two-week free trial or 100 uses upon the first download, allowing users to explore the premium features. With a desktop version available, users can maintain their analysis across different devices for a more integrated trading experience.
Requirements (Latest version)
- Android 2.3, 2.3.1, 2.3.2 or higher required


Comments
There are no opinions about Interactive Stock Charts yet. Be the first! Comment